Chapter 40. Gathering System Information
Before you learn how to configure your system, you should learn how to gather essential system information. For example, you should know how to find the amount of free memory, the amount of available hard drive space, how your hard drive is partitioned, and what processes are running. This chapter discusses how to retrieve this type of information from your Red Hat Enterprise Linux system using simple commands and a few simple programs.
40.1. System Processes
The ps ax command displays a list of current system processes, including processes owned by other users. To display the owner of the processes, along with the processes, use the command ps aux. This list is a static list; in other words, it is a snapshot of what was running when you invoked the command. If you want a constantly updated list of running processes, use top as described below.
The ps output can be long. To prevent it from scrolling off the screen, you can pipe it through less:
ps aux | less |
You can use the ps command in combination with the grep command to see if a process is running. For example, to determine if Emacs is running, use the following command:
ps ax | grep emacs |
The top command displays currently running processes and important information about them including their memory and CPU usage. The list is both real-time and interactive. An example of top's output is provided as follows:
top - 14:01:42 up 9 days, 23:48,  4 users,  load average: 0.10, 0.13, 0.07
Tasks:  96 total,   2 running,  94 sleeping,   0 stopped,   0 zombie
Cpu(s):  2.3% us,  0.3% sy,  0.0% ni, 95.4% id,  2.0% wa,  0.0% hi,  0.0% si
Mem:    645712k total,   613184k used,    32528k free,   176124k buffers
Swap:  1310712k total,        0k used,  1310712k free,   226136k cached

  PID USER      PR  NI  VIRT  RES  SHR S %CPU %MEM    TIME+  COMMAND
10456 root      14  -1 31408  17m 4828 S  2.3  2.7 158:16.98 X
18110 root      16   0  3032 1052  840 R  0.7  0.2   0:00.07 top
    1 root      16   0  3036  560  480 S  0.0  0.1   0:00.98 init
    2 root      34  19     0    0    0 S  0.0  0.0   0:00.10 ksoftirqd/0
    3 root       5 -10     0    0    0 S  0.0  0.0   0:00.07 events/0
    4 root       5 -10     0    0    0 S  0.0  0.0   0:00.01 khelper
    5 root      15 -10     0    0    0 S  0.0  0.0   0:00.00 kacpid
   17 root       5 -10     0    0    0 S  0.0  0.0   0:00.00 kblockd/0
   18 root      15   0     0    0    0 S  0.0  0.0   0:00.00 khubd
   27 root      20   0     0    0    0 S  0.0  0.0   0:00.00 pdflush
   28 root      15   0     0    0    0 S  0.0  0.0   0:01.96 pdflush
   30 root      12 -10     0    0    0 S  0.0  0.0   0:00.00 aio/0
   29 root      16   0     0    0    0 S  0.0  0.0   0:01.98 kswapd0
  103 root      25   0     0    0    0 S  0.0  0.0   0:00.00 kseriod
  173 root      23   0     0    0    0 S  0.0  0.0   0:00.00 scsi_eh_0
  174 root      15   0     0    0    0 S  0.0  0.0   0:00.00 ahc_dv_0
177 root 20 0 0 0 0 S 0.0 0.0 0:00.00 scsi_eh_1 |
To exit top, press the
Table 40-1 contains useful interactive commands that you can use with top. For more information, refer to the top(1) manual page.
| Command | Description |
|---|---|
| Immediately refresh the display | |
| Display a help screen | |
| Kill a process. You are prompted for the process ID and the signal to send to it. | |
| Change the number of processes displayed. You are prompted to enter the number. | |
| Sort by user. | |
| Sort by memory usage. | |
| Sort by CPU usage. |
Table 40-1. Interactive top commands
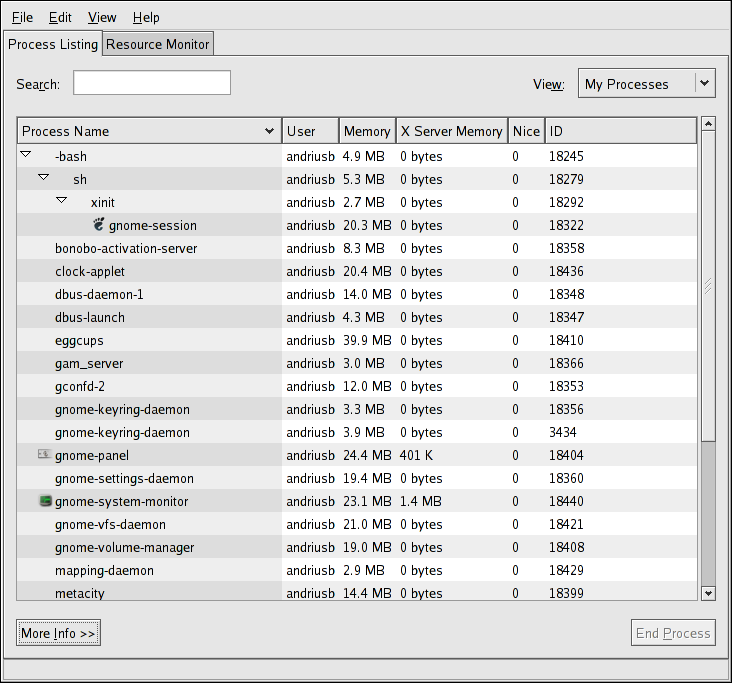
If you prefer a graphical interface for top, you can use the GNOME System Monitor. To start it from the desktop, select Applications (the main menu on the panel) => System Tools => System Monitor or type gnome-system-monitor at a shell prompt (such as an XTerm). Select the Process Listing tab.
The GNOME System Monitor allows you to search for a process in the list of running process as well as to view all processes, your processes, or active processes.
To learn more about a process, select it and click the More Info button. Details about the process is displayed at the bottom of the window.
To stop a process, select it and click End Process. This function is useful for processes that have stopped responding to user input.
To sort by the information in a specific column, click on the name of the column. The column that the information is sorted by appears in a darker gray color.